Limiting which Syscalls to Trace with Strace

Tracing a program with strace generates a lot of output because of the sheer number of syscalls every program calls during its runtime. This can become overwhelming very quickly, making it hard to analyze the trace and find what you are looking for.

Fortunately, strace has several features that allow you to limit which syscalls it actually traces.

Limiting by Name

The simplest mechanism to limit the number of traced syscalls is by specifying the name of one syscall you want to trace. To do this, you can use the -e flag followed by trace= and the name of the syscall. In this example we trace the /bin/ls program and we only want strace to report the openat syscalls executed by the program:

$ strace -e trace=openat /bin/ls

This should give you an output similar to this:

Continue reading “Limiting which Syscalls to Trace with Strace”

Finding out where Syscalls are Called From: Stack Traces with Strace

One of the great strengths of strace as a debugging tool is that it shows you what a program is doing regardless of whether it was compiled with debug info or not. The downside of this is that you only see the program’s syscall. You can use this information to deduce what is happening in the program but you don’t see from where in the program those syscalls originate.

The good news is that if your program was compiled with debug info strace can actually show a stack trace for every syscall in your binary.

Example

To demonstrate this we just save the following program to hello.c:

#include <stdio.h>

void print_info()
{
    int num = 5;
    printf("== Info ==\n");
    printf("Hello World!\n");
    printf("Num: %d\n", num);
}

int main(int argc, char **argv)
{
    print_info();
    return 0;
}
Continue reading “Finding out where Syscalls are Called From: Stack Traces with Strace”

Introduction to Strace

There is probably no debugging tool on Linux that is more valuable and versatile than strace. This tool shows us all the calls a program makes to the operating system, including the data it transmits to the operating system via these calls and the return values sent back by the OS. Therefore, it can give us a very good picture of what a program is doing.

And the best thing is that it works on any program. Neither do we need the source code of the program nor does it have to be compiled with debug information.

Stracing Hello World

To get our feet wet let’s start with the simplest possible example. We will run a Hello World program with strace to see what syscalls such a basic program will make.

So first we save the following program in a file named hello.c:

#include <stdio.h>

int main(int argc, char **argv)
{
    printf("Hello World\n");
    return 0;
}
Continue reading “Introduction to Strace”

Dynamic Printf Debugging with GDB

When we debug a program with printf() we have to recompile it whenever we add new printf() statements! Right!?

Wrong!

With gdb we can add printf() statements without recompiling a program and even add them while it is running.

Adding Printfs with GDB

Let’s say we have the following example program that computes the sum of all the elements of an array:

#include <stdio.h>

int main(int argc, char **argv)
{
    int numbers[] = {1, 2, 3, 4, 5, 6, 7, 8, 9, 10};
    int n = sizeof(numbers) / sizeof(numbers[0]);
    int sum = 0;

    for (int i = 0; i < n; i++) {
        sum += numbers[i];
    }

    printf("Sum of array: %d\n", sum);

    return 0;
}
Continue reading “Dynamic Printf Debugging with GDB”

Making the most of your Shells History on Linux and macOS

Modern UNIX shells like bash (default on Linux) and zsh (default on macOS) keep a history of all the commands you enter. The easiest way to access this history is by pressing the up and down cursor keys to browse through the last commands.

But this is only the tip of the iceberg. There are many more powerful history features that are easy to overlook. Learning them and making them second nature will help you to become much faster with a shell.

Viewing the History

The full history can be printed with the history command:

$ history
100 cd
101 vim file.txt
102 ls
103 mount
104 cat /etc/fstab
$
Continue reading “Making the most of your Shells History on Linux and macOS”

Getting started with GDB

Most programmers prefer to write code over debugging it. Unfortunately, code breaks a lot more often than we would like and it often breaks in situations that are hard to debug. Therefore, an essential skill as a programmer is to know how to debug your code (and that of others).

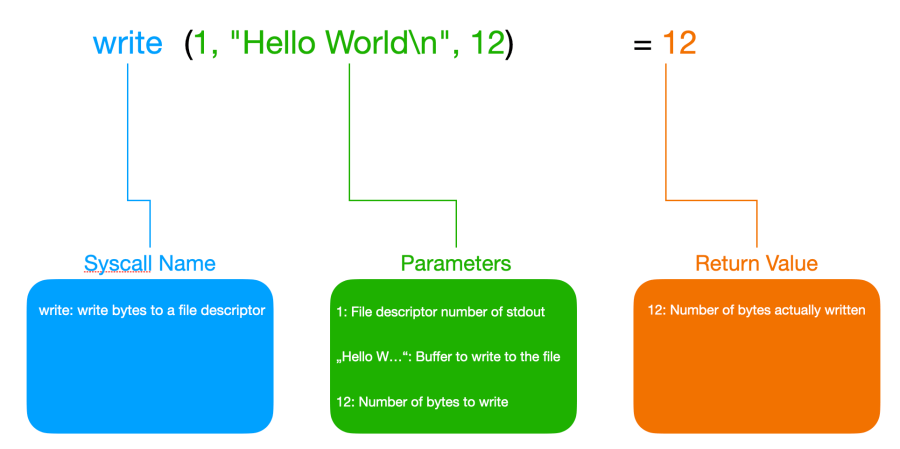
When facing our first bug we all start out with what is called printf debugging. That means we add lines of code that call printf (or any other print function) at relevant places in our code and output values of variables or just print a message that indicates that the execution of the program has reached this particular line in the code. Then we recompile the program, run it, reproduce the problem, and add more printf calls until we find the bug.

There is nothing wrong with printf debugging. It is the most basic method of debugging and it works quite well in many situations and is available to the programmer in nearly any environment. Lots of programs even write a log file during normal operation to help track down problems that happened in production. Log files are nothing else than built-in, glorified printf debugging.

printf debugging is great but it has its limitations. For example, you can’t step through a program line by line or just jump into a specific location and look around exploring the variables and the state of the program at the time.

Whenever you want to check a new variable or data structure that wasn’t on your radar before you have to add new printf statements to the code, recompile it, run it, and get the program into the desired error state. Also, there is no way to halt the program every time a certain variable or memory address is read or modified and see from which line of code the memory access happened.

All these things and more can be done with a debugger. And that is why it is crucial to know a good debugger and know it well.

One of the most popular and powerful debuggers is gdb. And it is also available on more platforms than probably any other debugger. This article will show you everything you need to know to debug your own programs with gdb.

Fixing a simple Crash

Let’s say you write a program in C or C++ and it crashes. While in languages like Java or Python, you will get a full-fledged stack trace all you get in our case is the message “Segmentation fault” in the terminal from which you started your program.

Continue reading “Getting started with GDB”

Structures in C: From Basics to Memory Alignment

Structures allow us to combine several variables to create a new data type. Some other languages support the same concept but call it “records”. If you come from object-oriented programming you can think about them as classes without methods.

Declaration

A structure is declared by the keyword struct followed by the name of the new structure and a list of its members enclosed in parentheses:

struct s {
    char a;
    int b;
    double c;
    char d[10];
};

Here we declared a new structure with the name s that has the members a (a single character), b (an integer), c (a double), and d (a char array of size 10 which can store up to 9 characters and a terminating null character).

Continue reading “Structures in C: From Basics to Memory Alignment”

Simple Raspberry Pi Backup

So you have set up your Raspberry Pi as a home server and everything works as intended. But what if the SD card fails and all the data you stored on your Raspberry Pi is suddenly lost forever?

All storage devices containing important data need to be backed up on a regular basis. And this is even more true for SD cards than for most other storage media. Because unlike hard drives and SSDs, SD cards are not really made for installing operating systems on them and they are also not designed for being powered on 24/7. Therefore, SD cards have a comparatively high risk of failing.

One thing is for sure: Your new Raspberry Pi needs a backup solution!

Wouldn’t it be nice if you just had a little Python script on your Linux PC that whenever executed logged on the Raspberry Pi via SSH, fetched all your data, and put it into a new timestamped subdirectory?

This is actually much easier than you might think. So let’s dive into this problem!

Continue reading “Simple Raspberry Pi Backup”

The Anomaly of the char Type in C

When we declare a variable of type int and we don’t tell the compiler if it is supposed to be signed or unsigned it is signed by default:

signed int s_number;   // signed
unsigned int u_number; // unsigned
int number; // equivalent with signed int

This is true for all integer number types (short, int, long, long long).

But there is one exception: The char type!

The char Type is Special

According to the C Standard, it depends on the implementation if char is signed or unsigned. The standard also says that char doesn’t collapse into one of signed char or unsigned char but is considered its own type (although it is represented internally as signed or unsigned, of course).

But the most surprising thing to know about char is that it is not guaranteed to be 8 bits. That means the C Standard does not guarantee a byte to be 8 bits. There are some very old architectures where char is 9 bits wide for example.

Fortunately for us, basically all architectures in use today have bytes that are 8 bits wide. Still, a program that assumes char to be 8 bits wide will not be portable to every platform where a C compiler is available.

Ask the Compiler

The characteristics of the char type (as well as all other types) are exposed in the standard header file limits.h. Therefore we can write a simple C program to find out how char is implemented on our platform:

#include <stdio.h>
#include <limits.h>

int main(void)
{
    printf("char bits:         %d\n", CHAR_BIT);
    printf("char is:           %s\n", CHAR_MIN < 0 ? "signed" : "unsigned");
    printf("signed char min:   %d\n", SCHAR_MIN);
    printf("signed char max:   %d\n", SCHAR_MAX);
    printf("unsigned char min: 0\n");
    printf("unsigned char max: %d\n", UCHAR_MAX);

    return 0;
}
Continue reading “The Anomaly of the char Type in C”