There is probably no debugging tool on Linux that is more valuable and versatile than strace. This tool shows us all the calls a program makes to the operating system, including the data it transmits to the operating system via these calls and the return values sent back by the OS. Therefore, it can give us a very good picture of what a program is doing.
And the best thing is that it works on any program. Neither do we need the source code of the program nor does it have to be compiled with debug information.
Stracing Hello World
To get our feet wet let’s start with the simplest possible example. We will run a Hello World program with strace to see what syscalls such a basic program will make.
So first we save the following program in a file named hello.c:
#include <stdio.h>

int main(int argc, char **argv)
{
    printf("Hello World\n");
    return 0;
}
We compile it with:
$ gcc -o hello hello.c
And then we can run it with:
$ strace ./hello
This command will run our hello program and print all the syscalls it makes:
execve("./hello", ["./hello"], 0xfffffefada40 /* 9 vars */) = 0
brk(NULL) = 0xaaab120da000
mmap(NULL, 8192, PROT_READ|PROT_WRITE, MAP_PRIVATE|MAP_ANONYMOUS, -1, 0) = 0xffffb948f000
faccessat(AT_FDCWD, "/etc/ld.so.preload", R_OK) = -1 ENOENT (No such file or directory)
openat(AT_FDCWD, "/etc/ld.so.cache", O_RDONLY|O_CLOEXEC) = 3
newfstatat(3, "", {st_mode=S_IFREG|0644, st_size=5643, ...}, AT_EMPTY_PATH) = 0
mmap(NULL, 5643, PROT_READ, MAP_PRIVATE, 3, 0) = 0xffffb948d000
close(3) = 0
openat(AT_FDCWD, "/lib/aarch64-linux-gnu/libc.so.6", O_RDONLY|O_CLOEXEC) = 3
read(3, "\177ELF\2\1\1\3\0\0\0\0\0\0\0\0\3\0\267\0\1\0\0\0\340u\2\0\0\0\0\0"..., 832) = 832
newfstatat(3, "", {st_mode=S_IFREG|0755, st_size=1637400, ...}, AT_EMPTY_PATH) = 0
mmap(NULL, 1805928, PROT_NONE, MAP_PRIVATE|MAP_ANONYMOUS, -1, 0) = 0xffffb92a1000
mmap(0xffffb92b0000, 1740392, PROT_READ|PROT_EXEC, MAP_PRIVATE|MAP_FIXED|MAP_DENYWRITE, 3, 0) = 0xffffb92b0000
munmap(0xffffb92a1000, 61440) = 0
munmap(0xffffb9459000, 3688) = 0
mprotect(0xffffb9438000, 61440, PROT_NONE) = 0
mmap(0xffffb9447000, 24576, PROT_READ|PROT_WRITE, MAP_PRIVATE|MAP_FIXED|MAP_DENYWRITE, 3, 0x187000) = 0xffffb9447000
mmap(0xffffb944d000, 48744, PROT_READ|PROT_WRITE, MAP_PRIVATE|MAP_FIXED|MAP_ANONYMOUS, -1, 0) = 0xffffb944d000
close(3) = 0
set_tid_address(0xffffb948ff30) = 238
set_robust_list(0xffffb948ff40, 24) = 0
rseq(0xffffb9490600, 0x20, 0, 0xd428bc00) = 0
mprotect(0xffffb9447000, 16384, PROT_READ) = 0
mprotect(0xaaaadb9b0000, 4096, PROT_READ) = 0
mprotect(0xffffb9494000, 8192, PROT_READ) = 0
prlimit64(0, RLIMIT_STACK, NULL, {rlim_cur=8192*1024, rlim_max=RLIM64_INFINITY}) = 0
munmap(0xffffb948d000, 5643) = 0
newfstatat(1, "", {st_mode=S_IFCHR|0620, st_rdev=makedev(0x88, 0), ...}, AT_EMPTY_PATH) = 0
getrandom("\x9a\xc4\x1e\x6c\x54\x81\x7e\x70", 8, GRND_NONBLOCK) = 8
brk(NULL) = 0xaaab120da000
brk(0xaaab120fb000) = 0xaaab120fb000
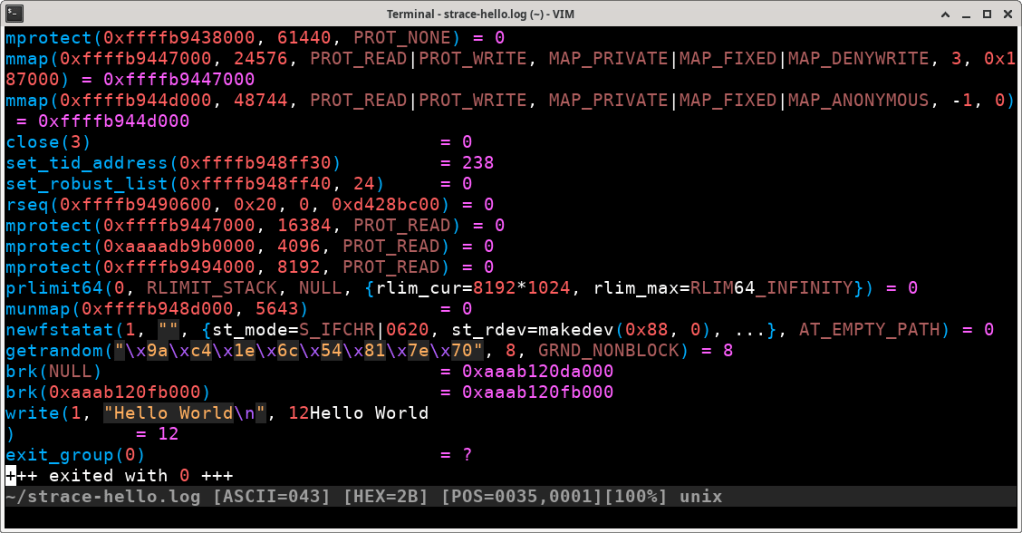
write(1, "Hello World\n", 12Hello World
) = 12
exit_group(0) = ?
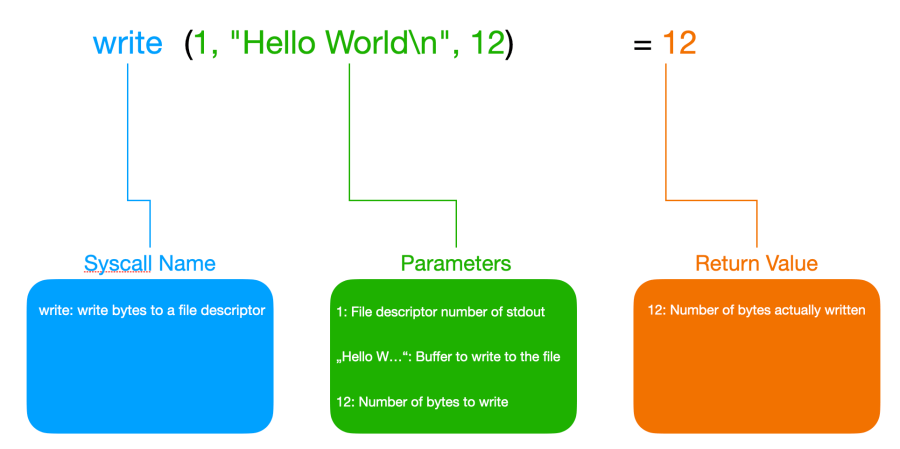
+++ exited with 0 +++Ok, this looks wild. Our simple Hello World program made 32 syscalls from start to finish. If you have never used strace before this output can be quite intimidating. But it is not as bad as it looks on first sight. So let’s first break down what the parts of a single line of strace output mean. For this, we use the write syscall at the end of the output that actually outputs our “Hello World” string (note that the “Hello World” output produced by this syscall is intermingled with the output for the syscall produced by strace, so we clean this up here):

As we can see here the write syscall takes a file descriptor in the form of an integer as its first parameter. In this case, this is file descriptor 1 which is stdout. The second parameter is a pointer to a buffer containing the bytes to be written. The address of the buffer wouldn’t be very helpful in most cases so instead of printing this address strace is so nice and prints the string contained in this buffer instead. The third parameter is the number of bytes the program wants to write to stdout. This value is 12 which equals the number of bytes in the string “Hello World” plus the line break.
What are Syscalls?
Syscalls are a mechanism that allows a process to talk to the operating system.
In all modern operating systems programs run as processes, that are completely isolated from each other. They have their own view of the system memory and they cannot change the memory of other processes or the operating system, nor can they access the hardware.
So whenever a process wants to access a file, print something to the screen, open a network connection or do anything but compute something on the CPU it has to ask the operating system to do it on its behalf.
Since the process runs in an unprivileged CPU mode and it has no access to the operating system’s memory it cannot just call a function in the operating system.
Instead, it puts the number of one of the syscalls defined by the OS and the appropriate parameters in previously agreed-upon registers. It then creates a so-called software interrupt. Every modern CPU has special instructions to create software interrupts. The CPU then drops into privileged mode and executes an interrupt handler routine that the OS has registered with the CPU as a handler for this software interrupt when it initialized itself. This routine will then call the appropriate kernel function which implements the syscall. Before the syscall returns it puts its return value in a previously agreed-upon register.
Since syscalls can only be called with assembly code the C library implements wrappers that allow us to call them like normal C functions.
The syscall has already been executed at this point and it returned the number of bytes written. Since this is also 12 we know that the syscall was successful and it did write all the bytes to stdout that it was supposed to write. In case of an error, it would have returned -1 and we could find the error code in the errno variable (and strace would print it directly in its output).
When we take a closer look at some of the lines in the strace output we can spot many other interesting things:
faccessat(AT_FDCWD, "/etc/ld.so.preload", R_OK) = -1 ENOENT (No such file or directory)Here the program (actually the dynamic loader) executed the faccessat syscall to check if it has the necessary permissions to access the file /etc/ld.so.preload. The syscall returned -1 because there was an error.
We already said that in such a case strace will check the errno variable and resolve the error information for us. This is exactly what it did here. The global variable errno contains an integer but strace already resolved this value to its symbolic constant ENOENT (which is a constant declared with #define in the kernel code). It also gives us a description of this still cryptic error (ENOENT literally stands for “no entry (in the directory)”). Its official description is “No such file or directory” as strace reports dutifully.
The other thing we see here is that strace translates flags to their symbolic names. The first parameter and the third parameter contain flags. Normally we would just see integers here. But strace knows the syscalls and therefore shows us the flags AT_FDCWD and R_OK. If more than one flag was set for a parameter strace would show them the way what they look like in C code: FLAG1 | FLAG2 | FLAG3 ....
We see this in this mmap syscall for example:
mmap(0xffffb92b0000, 1740392, PROT_READ|PROT_EXEC, MAP_PRIVATE|MAP_FIXED|MAP_DENYWRITE, 3, 0) = 0xffffb92b0000
But strace can do even more. When there is a pointer to a struct passed to a syscall strace will print the struct members:
newfstatat(3, "", {st_mode=S_IFREG|0755, st_size=1637400, ...}, AT_EMPTY_PATH) = 0Unfortunately, strace truncates the struct for brevity. If we want to see the full struct we must call strace with the -v parameter:
$ strace -v ./hello
Then we get the full output for this syscall:
newfstatat(3, "", {st_dev=makedev(0, 0x84), st_ino=156660, st_mode=S_IFREG|0755, st_nlink=1, st_uid=0, st_gid=0, st_blksize=4096, st_blocks=3200, st_size=1637400, st_atime=1710092166 /* 2024-03-10T17:36:06.795099006+0000 */, st_atime_nsec=795099006, st_mtime=1704201762 /* 2024-01-02T13:22:42+0000 */, st_mtime_nsec=0, st_ctime=1710092162 /* 2024-03-10T17:36:02.629099004+0000 */, st_ctime_nsec=629099004}, AT_EMPTY_PATH) = 0Writing the Output to a File
By default, strace writes its output to stderr. If you want the output to end up in a file for later investigation you can use the -o option:
$ strace -o strace-hello.log hello
If you want the output to appear on the screen and be saved to a file at the same time you can use this more complicated command instead:
$ strace hello 2>&1 | tee strace-hello.log
Another advantage of saving the output to a file is that some text editors (like vim in this example) support syntax highlighting for strace output:
Most Important Syscalls
The following table lists the most important syscalls:
| Name | Prototype | Return Value | Description |
| open | int open(const char *pathname, int flags, … /* mode_t mode */); | File Descriptor (positive number) or -1 on error | Opens a file and returns a the file descriptor |
| read | ssize_t read(int fd, void *buf, size_t count); | Number of bytes read or -1 on error | Reads at most count bytes from file into buf |
| write | ssize_t write(int fd, const void *buf, size_t count); | Number of bytes written or -1 on error | Writes at most count bytes from buf into file |
| close | int close(int fd); | 0 on success or -1 on error | Closes a file descriptor |
| exit | void exit(int status); | None | Terminates the calling process with the given status code |
Of course, there are many more syscalls. Every syscall has its own manpage in section 2 of the manual. So whenever you encounter a syscall that you don’t know or did forget about you can just look it up with man 2 followed by the name of the syscall.
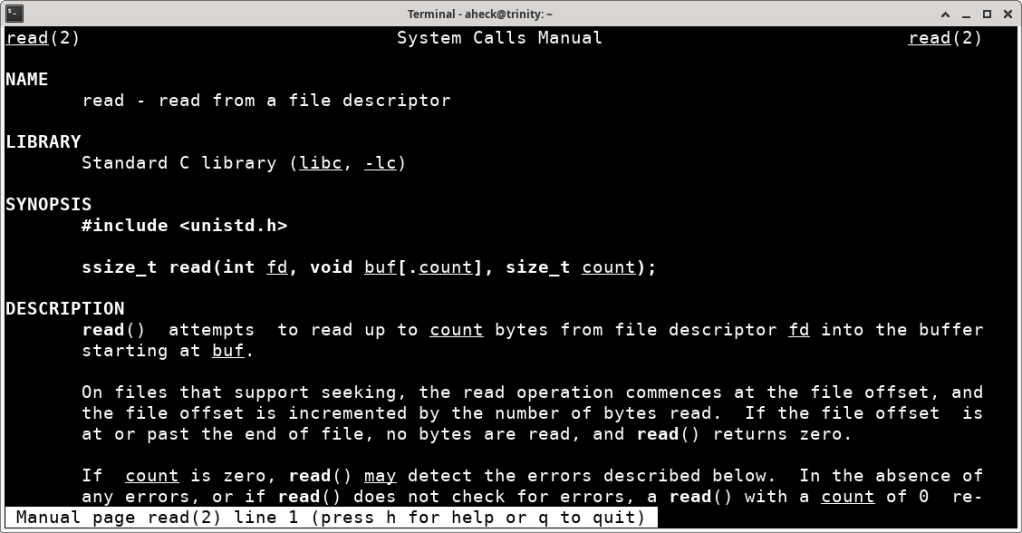
So if you want to learn more about the read syscall for example you could do so by entering the following command in a terminal:
$ man 2 read
The manpage should then be displayed like this:
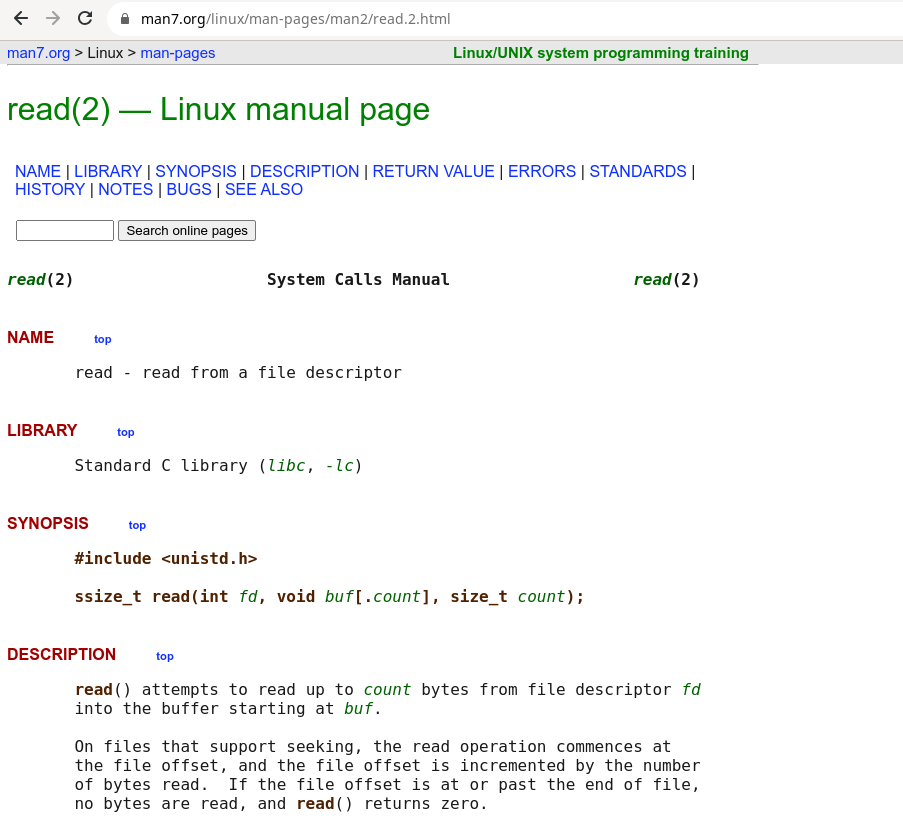
If you prefer to read manpages in a web browser instead, you can also just enter “man 2 read” into a search engine and you will end up on a website like this one:
Attaching to a Running Process
With strace we can not only start a program but we can also attach to a process that is already running. To demonstrate this we save this C program as wait-input.c:
#include <stdio.h>
#include <stdlib.h>

int main(int argc, char **argv)
{
    char input[20];

    printf("Waiting for input: ");
    fgets(input, sizeof(input), stdin);
    printf("You entered: %s\n", input);

    return 0;
}
and compile it with:
$ gcc -o wait-input wait-input.c
Then start it with:
$ ./wait-input
Once it is started, the program waits for user input. So when we go to another terminal and find out its process id with:
$ ps aux | grep wait-input
We can then use the process ID to attach strace to the already running process:
$ strace -p <PID>
Now strace will block until we enter some text in the other terminal and press enter. The output it shows will look similar to this:
strace: Process 5295 attached
read(0,
This behavior and the output show us that the program has started a read syscall and is waiting for it to return. This makes sense since the program is waiting for the user to enter some text on stdin (which is file descriptor number 0).
If we enter “Hello” in the terminal running the program and press enter the output in the strace terminal will be completed like this:
read(0, "Hello\n", 1024)                = 6
write(1, "You entered: Hello\n\n", 20)  = 20
exit_group(0)                           = ?
+++ exited with 0 +++
We see here that the formerly blocked read syscall has completed. It read the string “Hello\n” into a buffer and it was allowed to read a maximum of 1024 bytes.
After that, the program used the write syscall to write a string informing the user about the entered text to stdout and exited.
Following Child Processes
When we trace a program and this program creates new child processes while we trace it strace will not trace those child processes but it will only show us the syscalls called by the initial process.
To illustrate that we use the following program:
#include <stdio.h>
#include <stdlib.h>

#include <sys/types.h>
#include <unistd.h>

int main(int argc, char **argv)
{
    pid_t p;

    p = fork();

    if (p < 0) {
      perror("fork fail");
      exit(1);
    } else if (p == 0) {
        printf("Hello from the child\n");
    } else {
        printf("Hello from the parent\n");
    }

    return 0;
}
This program only creates a child process and then it prints a hello message from the child as well as from the parent process.
Save this program to fork.c and compile it with the following command:
$ gcc -o fork fork.c
When we trace it with
$ strace ./fork
we get the following output:
...
clone(child_stack=NULL, flags=CLONE_CHILD_CLEARTID|CLONE_CHILD_SETTID|SIGCHLD, child_tidptr=0xffffb5bb0f30) = 1314
Hello from the child
newfstatat(1, "", {st_mode=S_IFCHR|0620, st_rdev=makedev(0x88, 0), ...}, AT_EMPTY_PATH) = 0
--- SIGCHLD {si_signo=SIGCHLD, si_code=CLD_EXITED, si_pid=1314, si_uid=0, si_status=0, si_utime=0, si_stime=0} ---
getrandom("\x43\xd2\x64\x6f\x1b\xac\xec\xb7", 8, GRND_NONBLOCK) = 8
brk(NULL)                               = 0xaaaaf3ca2000
brk(0xaaaaf3cc3000)                     = 0xaaaaf3cc3000
write(1, "Hello from the parent\n", 22Hello from the parent
) = 22
exit_group(0)                           = ?
+++ exited with 0 +++
The clone syscall is where the actual creation of the child process happens. We can see the output “Hello from the child” in the trace but we don’t see the write syscall that produced it. We only see the write syscall that is used by the parent. This is because the child process is not traced by strace.
To tell strace to also trace all child processes created by the main process we need to start strace with the -f flag:
$ strace -f ./fork
...
clone(child_stack=NULL, flags=CLONE_CHILD_CLEARTID|CLONE_CHILD_SETTID|SIGCHLDstrace: Process 1309 attached
, child_tidptr=0xffffa12a0f30) = 1309
[pid  1309] set_robust_list(0xffffa12a0f40, 24 <unfinished ...>
[pid  1308] newfstatat(1, "",  <unfinished ...>
[pid  1309] <... set_robust_list resumed>) = 0
[pid  1308] <... newfstatat resumed>{st_mode=S_IFCHR|0620, st_rdev=makedev(0x88, 0), ...}, AT_EMPTY_PATH) = 0
[pid  1308] getrandom( <unfinished ...>
[pid  1309] newfstatat(1, "",  <unfinished ...>
[pid  1308] <... getrandom resumed>"\x65\x76\xdb\x18\xec\x63\x1e\x42", 8, GRND_NONBLOCK) = 8
[pid  1309] <... newfstatat resumed>{st_mode=S_IFCHR|0620, st_rdev=makedev(0x88, 0), ...}, AT_EMPTY_PATH) = 0
[pid  1308] brk(NULL <unfinished ...>
[pid  1309] getrandom( <unfinished ...>
[pid  1308] <... brk resumed>)          = 0xaaab0c67a000
[pid  1309] <... getrandom resumed>"\xac\x52\xda\x6b\x43\xa2\xa4\x61", 8, GRND_NONBLOCK) = 8
[pid  1308] brk(0xaaab0c69b000 <unfinished ...>
[pid  1309] brk(NULL <unfinished ...>
[pid  1308] <... brk resumed>)          = 0xaaab0c69b000
[pid  1309] <... brk resumed>)          = 0xaaab0c67a000
[pid  1308] write(1, "Hello from the parent\n", 22 <unfinished ...>
[pid  1309] brk(0xaaab0c69b000Hello from the parent
 <unfinished ...>
[pid  1308] <... write resumed>)        = 22
[pid  1309] <... brk resumed>)          = 0xaaab0c69b000
[pid  1308] exit_group(0 <unfinished ...>
[pid  1309] write(1, "Hello from the child\n", 21 <unfinished ...>
[pid  1308] <... exit_group resumed>)   = ?
Hello from the child
[pid  1309] <... write resumed>)        = 21
[pid  1308] +++ exited with 0 +++
exit_group(0)                           = ?
+++ exited with 0 +++
In this trace, we can now see that directly after the creation of the child process with the clone syscall strace starts to print either [pid 1308] or [pid 1309] before each syscall. From the parameters of the write syscalls we can deduce that 1308 is the PID of the parent process and 1309 is the PID of the child process.
Without this additional information, we would not be able to properly read the trace anymore because we would not know from which process the syscalls in the trace originated. But you can probably imagine that it still gets very messy when we have many child processes. In this case, it is often a good idea to tell strace to write our output to a file and to write the output of every process to a separate file.
To do this we need to use the -o option that we have used before to tell strace to write its output to a single file. Instead of -f we then use -ff to tell strace to follow forks and to write the trace of every process to a separate file:
$ strace -o fork-trace.txt -ff ./fork
Instead of creating the file fork-trace.txt strace will create two files with a dot and the PID of the process appended. When I executed this command on my machine it created the two files fork-trace.txt.1318 and fork-trace.txt.1319 with the respective traces of the parent and the child (PIDs change with every program run and will very probably be different on your machine).
Tracing Only the Syscalls You Care About
All this output of strace can be quite confusing and sometimes you only care for one or a few very specific syscalls.
If you want strace to trace only one specific syscall you can use the -e parameter like this:
$ strace -e write ./hello
This command traces only the write syscall in our hello program. Suddenly, the dozens of lines of trace output that we saw at the beginning of this article reduce to this:
write(1, "Hello World\n", 12Hello World
)           = 12
+++ exited with 0 +++
If we want to trace several selected syscalls we can just pass a comma-separated list of syscall names to the -e parameter:
$ strace -e write,close ./hello
In our case, this would yield the following output:
close(3)                                = 0
close(3)                                = 0
write(1, "Hello World\n", 12Hello World
)           = 12
+++ exited with 0 +++
Profiling Syscalls
But strace can even help us to find out why a program is running slowly. If we start strace with the -t flag it will print the clock time in hours, minutes, and seconds before each syscall. E.g.:
$ strace -t ./hello
20:35:48 execve("./hello", ["./hello"], 0xffffca8ed9e8 /* 9 vars */) = 0
20:35:48 brk(NULL)                      = 0xaaaade278000
20:35:48 mmap(NULL, 8192, PROT_READ|PROT_WRITE, MAP_PRIVATE|MAP_ANONYMOUS, -1, 0) = 0xffff815c0000
20:35:48 faccessat(AT_FDCWD, "/etc/ld.so.preload", R_OK) = -1 ENOENT (No such file or directory)
20:35:48 openat(AT_FDCWD, "/etc/ld.so.cache", O_RDONLY|O_CLOEXEC) = 3
20:35:48 newfstatat(3, "", {st_mode=S_IFREG|0644, st_size=9423, ...}, AT_EMPTY_PATH) = 0
20:35:48 mmap(NULL, 9423, PROT_READ, MAP_PRIVATE, 3, 0) = 0xffff815bd000
20:35:48 close(3)
...
With such a trace we just need to look for gaps of multiple seconds between two syscalls. If such a gap exists we can then take a closer look at the surrounding syscalls to figure out what our program is doing and where in our code those syscalls are called.
Another performance problem that we could see is certain syscalls are executed way too often. One such example would be if the write syscall is executed too often with very small buffers. In such a case the performance would probably be improved by using bigger buffer to reduce the numbe of syscalls, since syscalls are expensive. Since strace shows us the syscalls, as well as the buffers, such implementation problems are easy to spot.
Of course, with our simple “Hello World” program there are no performance problems and everything runs within the same second. Everything else would be a big surprise.
Conclusion
Strace is an incredibly powerful tool and every advanced Linux user should know how to use it. Hopefully, this article has given you all the knowledge you need to get started with it. If you want to dig even deeper and learn about all the features this great program has to offer the best way to do this is by reading the extensive strace manpage.
